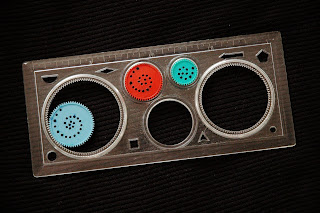
Some examples of mathmatical curves (described in cylindrical coordinate systems) insired by the spirograph we all played around with as kids...

Here an a bit more advanced version of it as to find in Science Museum London:

Here an example of the Hypotrochoid curve:
similar: the Roses Curves:
one function creates all those different shapes:

Here an a bit more advanced version of it as to find in Science Museum London:

Here an example of the Hypotrochoid curve:
similar: the Roses Curves:
one function creates all those different shapes:
the grasshopper definition:


3 comments:
hi
i would like to see larger videos or images of the two grasshopper setups...where can I find these? are you willing to give out the files?
Going to be away for the next week, but I hope afterwards I find some time to add the GH_definitions to the post...
There is already a screenshot of the rose_curve definition.
What you can't see are the functions.
The first function on the left is just n/d.
The curve function is sin(k*t).
The two functions for translating cylindrical to cartesian coordinates are:
x = r * cos(t)
y = r * sin(t)
Thats all...
Marc
thanks for the help. got the roses curves going - sort of. after getting the points you fed them into a crv component right? i see the points resembling your grid of curves that the rose equation can produce but the curves themselves look different because the points are being used as controllers. Can you help noob figure this one out?
Post a Comment